Statistics / Credit graph
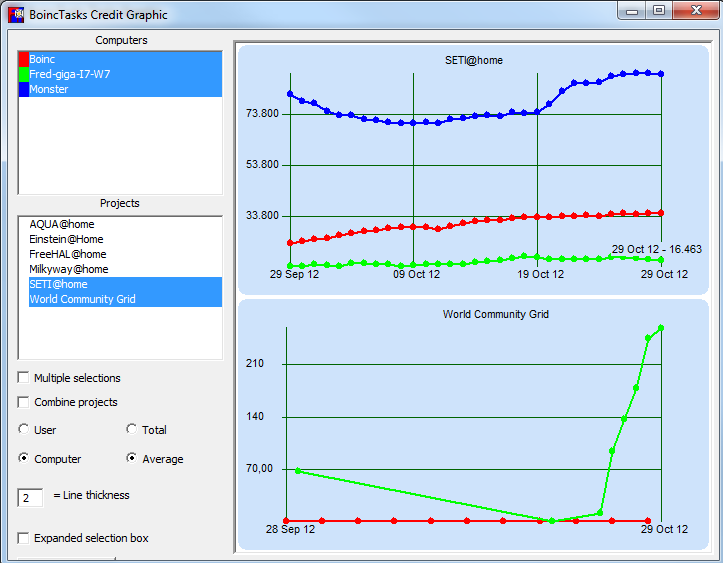
Enlarge
Double click on the graph to maximize the graph and hide the left side.
Computers and Projects
Select at least one computer and project
Use the Ctrl key for multiple selections.
Multiple selections
Check this box for selecting multiple items, just by clicking on them.
Combine projects
Unless checked, projects are shown in separate tiles.
Checking this item combines the projects or computers in one graph.
But you can select multiple items only on Computers or Projects, not on both.
Line thickness
Allow for narrow “1” or wider “2” graph lines.
Expanded selection box
You can check this one, if you have more than 8 computers or projects.
Update
Refreshes the Computer and Projects, this is normally only needed when adding or removing Projects.
Tips
Tips, small windows are shown, when you keep the mouse pointer over one of the points in the graph, to get more detailed information.
Colors
Colors can be adjusted in the menu: Extra->BoincTasks colors and fonts->Graphic.
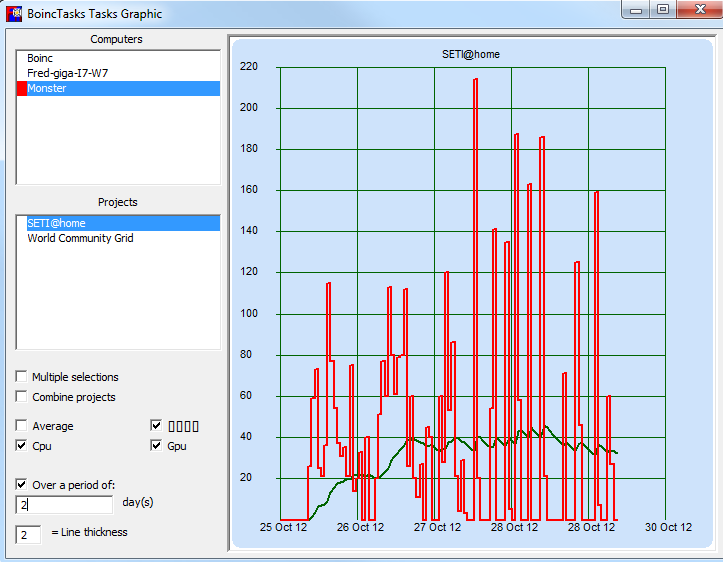
For best results, the history must be enabled. But if the history is disabled, you can still see the tasks that are still on the system.
Enlarge
Double click on the graph to maximize the graph and hide the left side.
Computers and Projects
Select at least one computer and project
Use the Ctrl key for multiple selections.
Multiple selections
Check this box for selecting multiple items, just by clicking on them.
Combine projects
Unless checked, projects are shown in separate tiles.
Checking this item combines the projects or computers in one graph.
But you can select multiple items only on Computers or Projects, not on both.
Average
Shows the 24 hour average line, separately
[][][]
Show in block mode. (preferred)
CPU GPU
Show CPU, GPU or both.
Over a period of:
When unchecked, everything is shown. When checked only the time period, in days is shown
Line thickness
Allow for narrow “1” or wider “2” graph lines.
Expanded selection box
You can check this one, if you have more than 8 computers or projects.
Update
Refreshes the Computer and Projects, this is normally only needed when adding or removing Projects.
Colors
Colors can be adjusted in the menu: Extra->BoincTasks colors and fonts->Graphic.
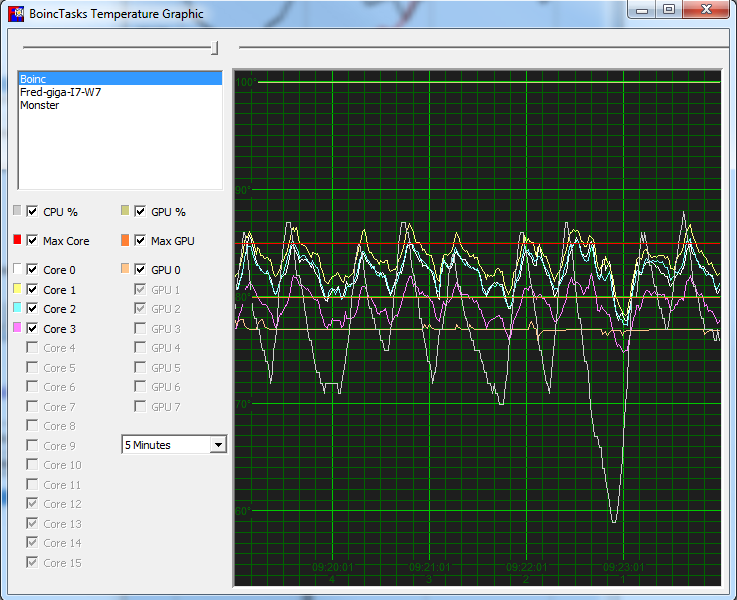
You need to install TThrottle on all computers, you want to read the temperatures from.
Enable BoincTasks in TThrottle and enable TThrottle in BoincTasks.
For added security, you can use a password. Make sure you set the password on both ends.
Enlarge
Double click on the graph to maximize the graph and hide the left side.
Sliders
With the two sliders close to the header, you can go back in time.
The clock time is shown in the bottom of the graph.
Colors
Colors can be adjusted in the menu: Extra->BoincTasks colors and fonts->Temperature.
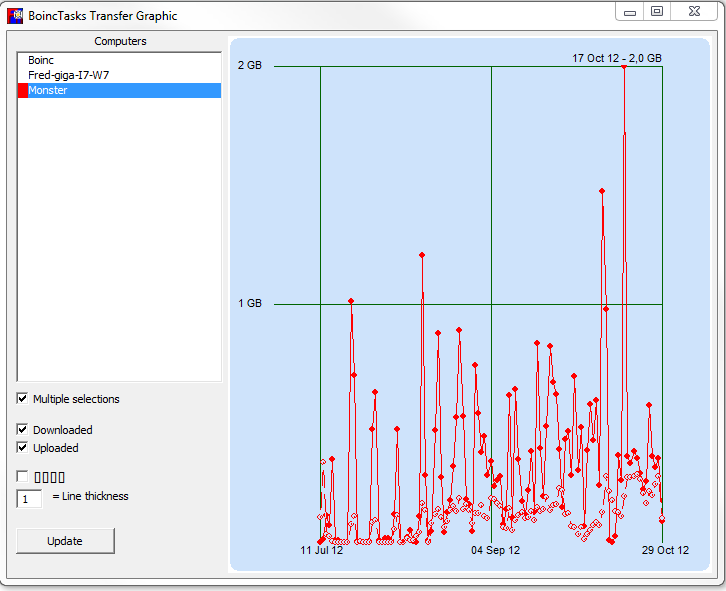
This graph shows the Interned, data transfer. You need BOINC V7 for this to work.
Enlarge
Double click on the graph to maximize the graph and hide the left side.
Computers
Use the Ctrl key for multiple selections.
Multiple selections
Check this box for selecting multiple items, just by clicking on them.
Downloaded and Uploaded
Show downloaded and or uploaded data.
[][][]
Show in block mode.
Line thickness
Allow for narrow “1” or wider “2” graph lines.
Update
Refreshes the Computer and Projects, this is normally only needed when adding or removing Projects.
Colors
Colors can be adjusted in the menu: Extra->BoincTasks colors and fonts->Graphic.
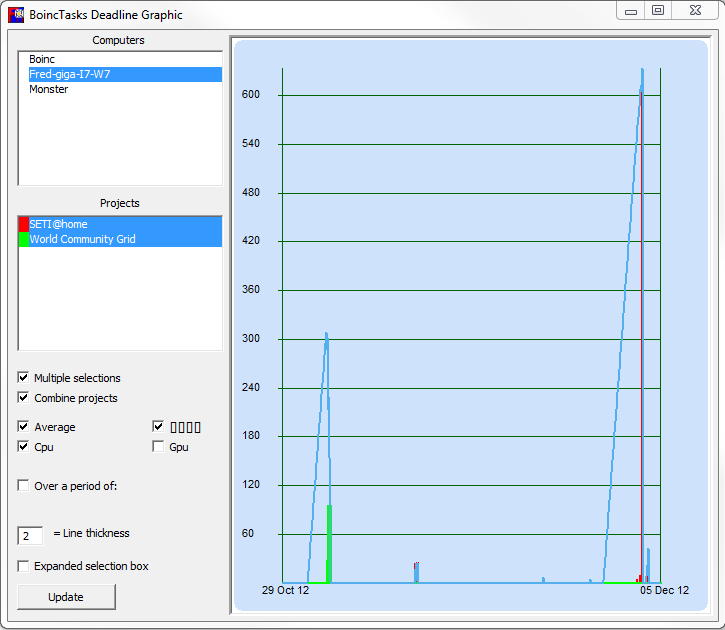
The bars show the amount of work (in hours) for a specific deadline. The amount of work is adjusted for the number CPU and GPU running.
If the average line reaches zero, before the current line indicator (vertical line to the left), the work is completed in time.
Vertical: Time in hours.
Horizontal: Wall clock time. The small vertical line is the current time.
WARNING: As of V 1.47, the graph adjusts to the amount of time the Client runs, if the BoincTasks Settings->View “Adjust time to BOINC client run time” is checked.
Otherwise the graph is based on 100% run time.
Enlarge
Double click on the graph to maximize the graph and hide the left side.
Computers and Projects
Select at least one computer and project
Use the Ctrl key for multiple selections.
Multiple selections
Check this box for selecting multiple items, just by clicking on them.
Combine projects
Unless checked, projects are shown in separate tiles.
Checking this item combines the projects or computers in one graph.
But you can select multiple items only on Computers or Projects, not on both.
Average
Shows the completion line
[][][]
Show in block mode. (preferred)
CPU GPU
Show CPU, GPU or both.
Over a period of:
When unchecked, everything is shown. When checked only the time period, in days is shown
Line thickness
Allow for narrow “1” or wider “2” graph lines.
Expanded selection box
You can check this one, if you have more than 8 computers or projects.
Update
Refreshes the Computer and Projects, this is normally only needed when adding or removing Projects.
Colors
Colors can be adjusted in the menu: Extra->BoincTasks colors and fonts->Graphic.
More technical, how the calculation works:
The graph represents the amount of work left in time slices of one hour. E.g. 10 tasks that fall within one time slice are combined into a single bar, one hour wide.
graphBar = TimeLeft / UpTime / Cores TimeLeft in slices of one hour, everthing within the one hour period is combined. UpTime between 0 and 1 (1 = running 100%)
If Extra->BoincTasks settins->view “Adjust time to BOINC client run time” is NOT checked UpTime is ALWAYS 1.
Example: Computer runs 40% of the time, the number of cores is 4 and the time left is 4 hours in one time slice of 1 hour: 4 (TimeLeft) / 0.4 (UpTime) / 4 (Cores) = 2.5 hour
The average line, shows the time it takes to run the tasks. So when the average line hits 0 the task is completed and this gives an indication, if the tasks can be completed in time.