eFMer TThrottle
TThrottle measures the processor core temperature and can adjust the amount of time a certain process (program/app) may run. What it does; it stops all threads of the process for a short amount of time. This will keep the temperature below the “Set Temperature”.
The regulator runs in a driver, so the actual TThrottle program can run a a regular user. If the temperature is below this value the Run Time will be 100%.
Supported systems:
At the moment only Intel and AMD Processors are supported, that have an internal temperature sensor to measure the core temperature.
But you can use external programs like
HWiNFO ![]() , GPU-Z and Open Hardware Monitor (discontinued) to read and use other sensors, to do so head to the External sensor chapter below.
, GPU-Z and Open Hardware Monitor (discontinued) to read and use other sensors, to do so head to the External sensor chapter below.
Installation:
TThrottle comes as a combined 32/64 bits version, so one installer is all you need.
The installation file setup_32_64_tthrottle_x_x_x, will extract all files into the directory [program files][efmer/tthrottle] and installs a driver.
TThrottle itself can run on a regular user account, no need to run it as Administrator.
Operation modes:
Temperature regulation
- This is the normal mode, the program throttles the programs according to the “set temperature”.
Throttle only
- The program can run without the temperature regulation. By setting Min and Max runtime at the same value e.g. 60. The programs in the list will run 60% of the time.
Quick Start
This is all you have to do to run TThrottle.
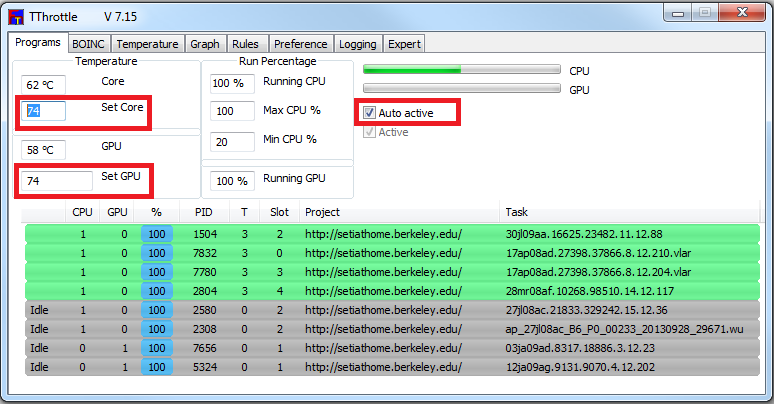
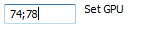
Type in the temperature at “Set” e.g. 74 (C).
Select “Auto Active” and you are done….
To hide TThrottle press “[X]” and TThrottle will not show itself the next time you start your computer, it hides itself in the Taskbar.
To start TThrottle every time you log in: You need to run TThrottle as administrator once. To do so, go to Programs->TThrottle, with the right mouse key on TThrottle, select “run as administrator” Next go to the preference tab and select.
Preference
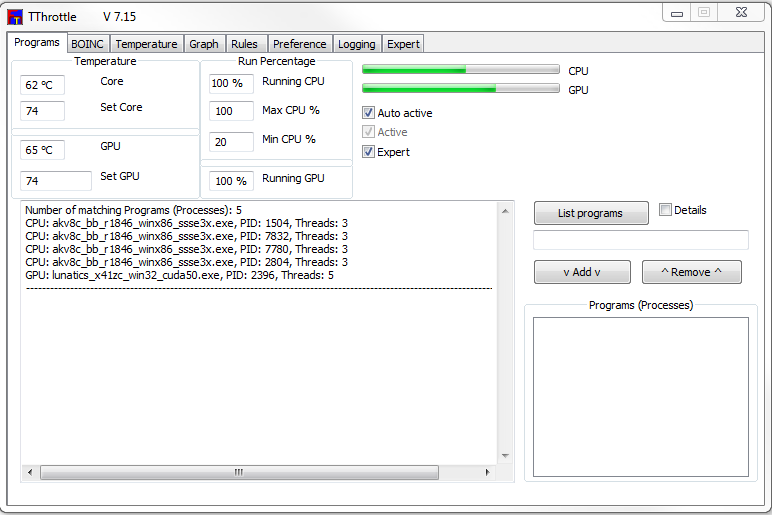
- “Temperature” “Core” The actual processor core temperature.
- “Set Core” Is the temperature you want TThrottle to maintain.
- “Run Percentage” “Max” The maximum time (in %) a task is allowed to run. Default 100.
- “Run Percentage” “Min” The minimum time (in %) a task is allowed to run. Default 5. And can’t be set below 5. Otherwise the task may freeze.
- “Run Percentage” “Running” The time the tasks are running at the moment, in %.
- “Auto Active” Activates the throttle and checks to update the running programs.
Icon
![]() The TThrottle icon is placed in the Taskbar. Clicking the right mouse over the icon, will display a menu.
The TThrottle icon is placed in the Taskbar. Clicking the right mouse over the icon, will display a menu.
![]() When the throttle, CPU or GPU, is not at 100%, this icon will be displayed instead.
When the throttle, CPU or GPU, is not at 100%, this icon will be displayed instead.
The top bar is the CPU and the bottom one the GPU. In this case the CPU is at 50% and the GPU is at 100%.
Colors: green: 100%, blue: allowed % and red: throttled %. So the more red the more throttling.
BOINC
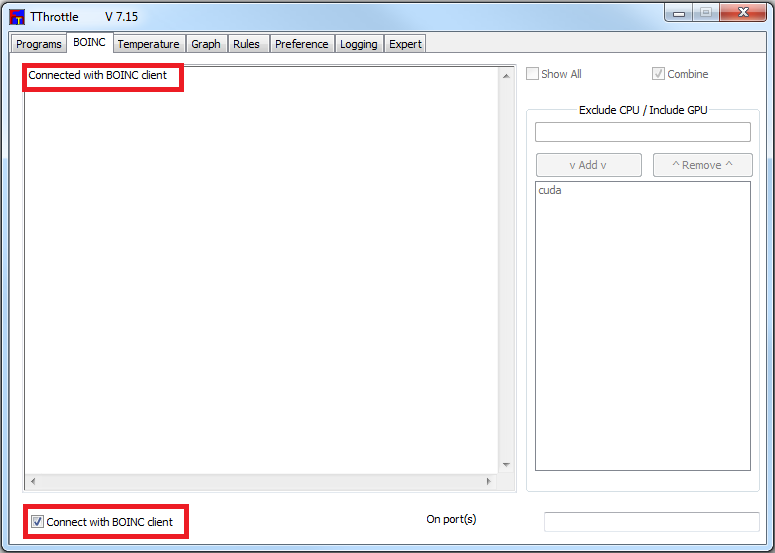
This tab appears automatically and only if a BOINC data directory is found.
The default mode is “Connect with BOINC client”, this will handle everything automatically.
Normally this field is empty!
In special occasions, you may want to run multiple BOINC clients on the same machine.
In this case you need to supply the ports you use:
You may want to switch to manual mode, by removing the check at “Connect with BOINC client”.
But only if you want to accomplish something special.
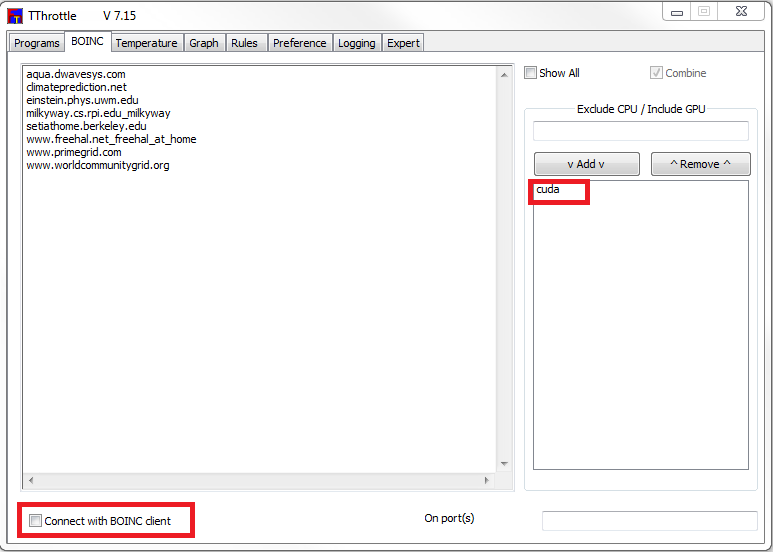
Projects are added automatically.
In this case you need to add a unique part of the exe name in the “Exclude” list.
Normally this is something like: cuda. This list should at least include all CUDA/ATI programs.
Graph
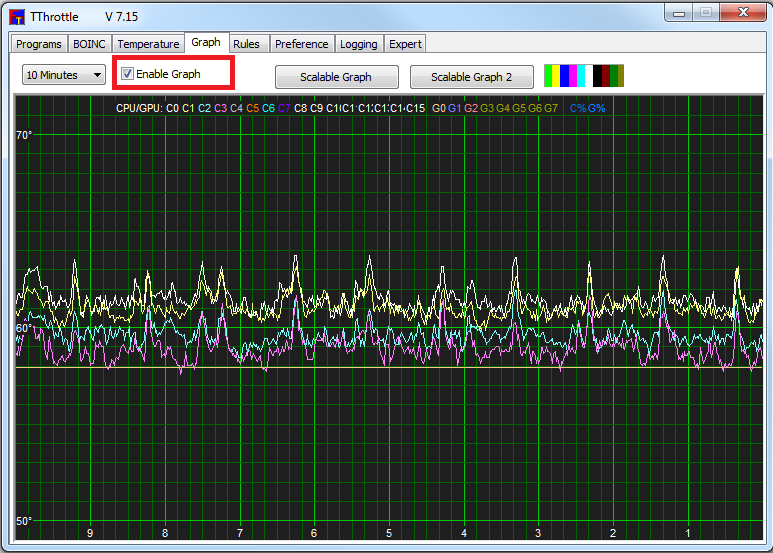
View the temperature in minutes or hours.
There a two “Scalable graphs”, one e.g. for the CPU and one for the GPU. Press “Scalable Graphic” and the following window will pop up.
“Enable Graph” must be checked for the graph to appear. Select the items you want to be shown and select the time period.
The first 2 buttons, skip one day back and forth.
The 2 sliders let you zoom in on a particular event. The right slider is the fine adjustment.

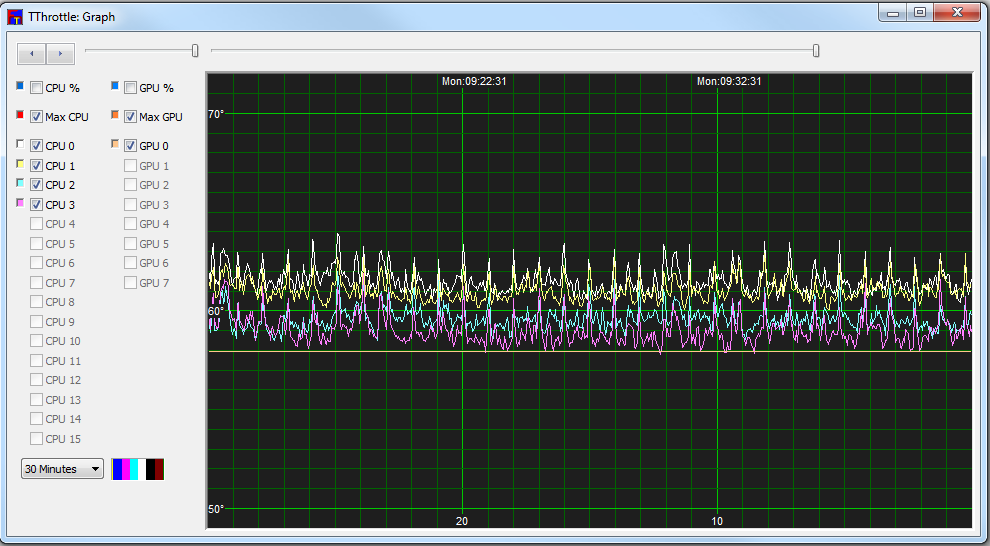
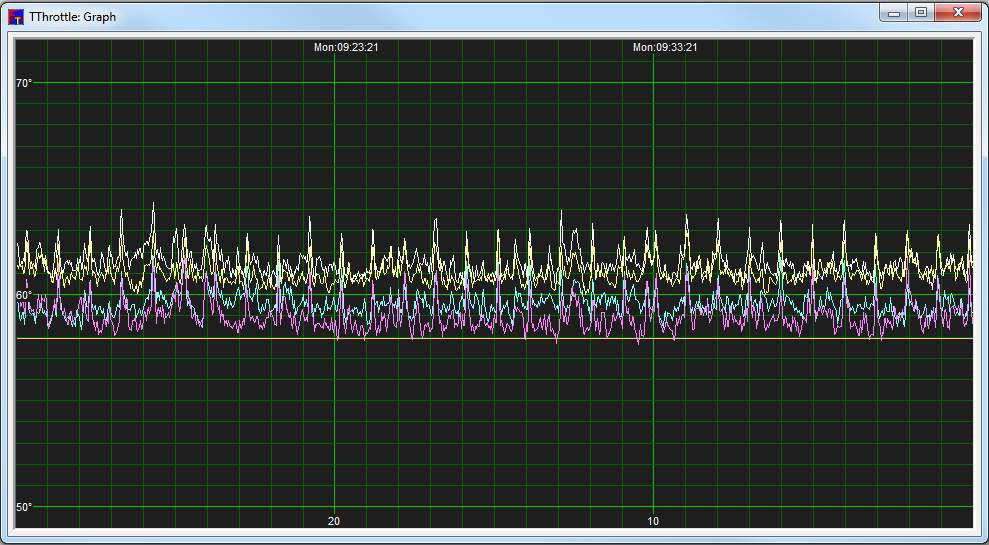
Double clicking on the graph, shows the graph only.
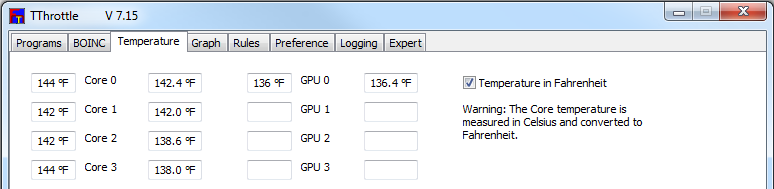
Fahrenheit
The core temperatures are read in Celsius.
To get a conversion to Fahrenheit, check “Temperature in Fahrenheit”
GPU CUDA/ATI
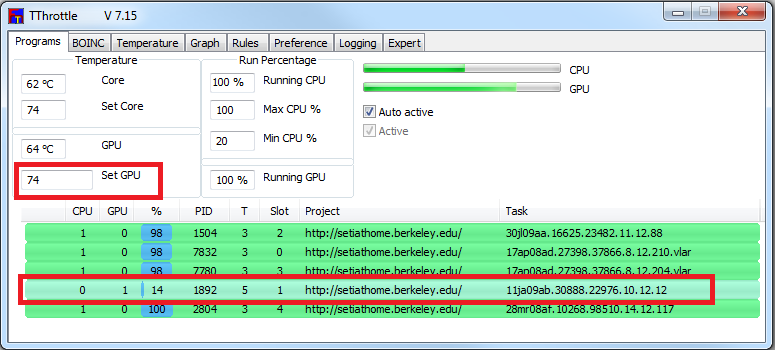
To regulate the GPU temperature, type in the desired temperature at “set GPU” and check “Auto Active”
The GPU task(s), will be regulated from this point on.
If you have more than one GPU, you may adjust the GPU temperature individually. Use a ; as delimiter.
Note:
If you don’t want the GPU to throttle set in a high value, like 200.
You must fill in a CPU and GPU value, a blank (space) will revert to 0C, aka full throttle.
All temperature values entered are effective as you type.
The temperature window

A small floating window, can display the temperatures of all CPU and GPU cores. This window can be placed anywhere on the desktop, even over the Taskbar.
Dragging is performed, by pressing the left mouse button, while over the window. Release the left mouse key and press again to drag.
Setup:
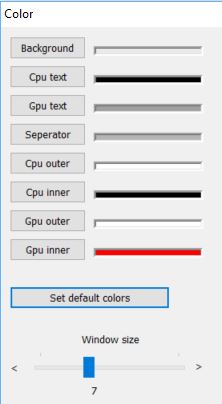
Clicking on the window with the right mouse button will display this menu:
To enable or disable the window ,go the preference tab.
You may also set a Hot-key to show and hide the window, with a key combination.
Program Settings Expert
In the BOINC tab you need to remove the check at: “Connect with BOINC client”.
Check “Expert” for more detailed throttling of non BOINC tasks.
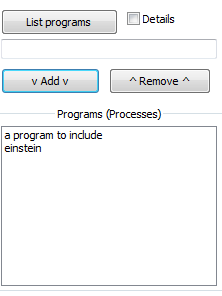
- “List Programs” lists all running processes on your computer
- “Programs” For specials only. BOINC projects are automatically added. All processes that start with this name will be found. So you don’t have to type the complete name. But be sure there are no other processes starting with the same name.
- “v Add v” Add a program to the list.
- “^ Remove ^” Remove a program from the list.
Example adding programs
This is normally not needed as projects (and all the programs in it) are automatically added from the BOINC data directory.
The following is for non BOINC programs and special cases only.
To add a program, copy part of the exe name into the field and press “v Add v”;
To remove one item, select it and press “^ Remove ^”.
Rules
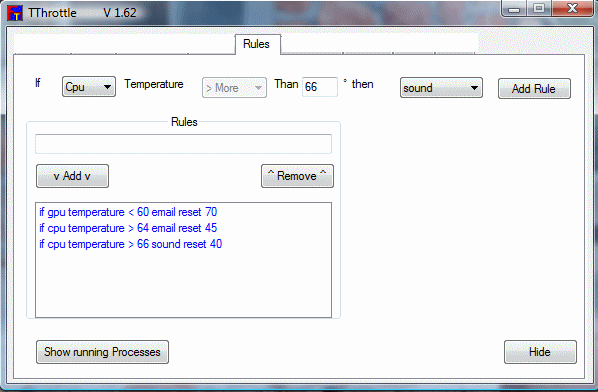
The rules tab allows for:
- The general throttle to engage.
- The alarm to sound.
- Sending an E-Mail.
- Shutdown or reboot of the computer
These actions take place, when a temperature goes below or above a certain setting.
What is the general throttle? Normally TThrottle only throttles the BOINC tasks, or additional added programs. The general throttle on the other hand, throttles every running program on the computer, including BOINC projects.
Use the general throttle only in emergencies and not all the time, because this feature takes up more time than the regular throttle.
External
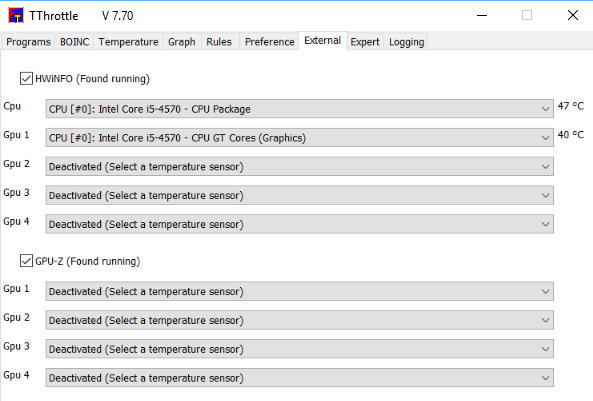
In this tab you can setup TThrottle to use temperature sensors read by HWiNFO, GPU-Z or Open Hardware Monitor (discontinued).
HWiNFO:
Start the HWiNFO and select “Sensors-only” at startup or click on sensors when the main program is running.
Now select Shared Memory Support see below in Note.
The default sensor polling frequency of 2 seconds may be too long for a smooth regulation. Try the following Polling Frequency settings: Global: 500 ms.
When using the installer, the 64 bit version stops working after 12 hours.
Use the 32 bit Portable version, that has no build in limitations and works fine on a 64 bit system.
Note: You need to select Shared Memory Support otherwise TThrottle cannot detect HWiNFO.
HWiNFO: Settings -> Main Settings -> check “Shared Memory Support”.
GPU-Z:
Nothing to set up, just run the program, either the stand alone or the installed version. Note: GPU-Z can only read the GPU temperatures.
Open Hardware Monitor:
Discontinued, but should work if you have a copy or find one online.
TThrottle:
Once TThrottle detects HWiNFO, GPU-Z or Open Hardware Monitor TThrottle shows: HWiNFO (found running) or GPU-Z (found running)
Next check HWiNFO, GPU-Z or Open Hardware Monitor.
Now select one of the running external sensors.
All sensors are initially deactivated, select a sensor for CPU and or GPU.
Once an external CPU or GPU sensor is activated TThrottle disables its own CPU or GPU sensor.
It’s allowed to use the CPU or GPU sensor from any available external source or from TThrottle.
You can e.g. use TThrottle CPU reading and the GPU reading from an external source.
Expert mode settings
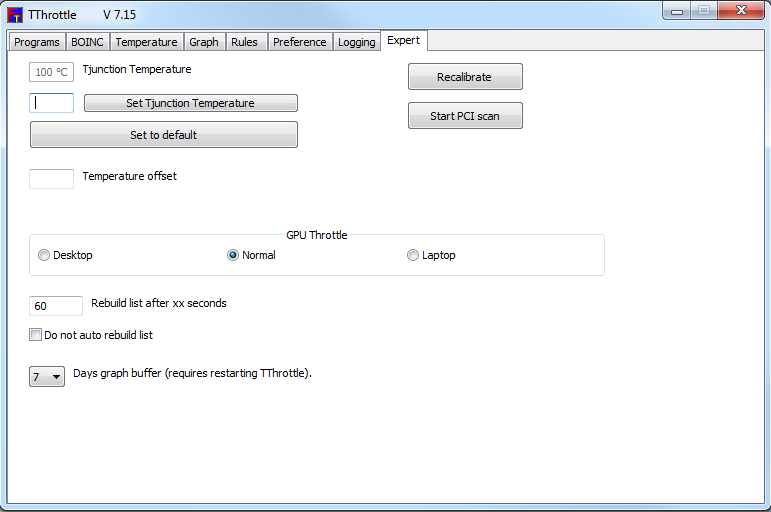
Sometimes the GPU throttle works too fast or too slow.
Select “desktop” for slow regulating and “laptop” for fast regulation.
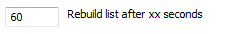
Normally the program list rebuilds every 60 seconds.
Sometimes this is not frequent enough. Set this to a lower value, to get a rebuild quicker
A rebuild is done earlier, if TThrottle detects a missing exe.
Set this check to take it easy and rebuild only at the set interval.
TThrottle can keep a copy of the temperature graph on disk.
You can set this to 1 – 7 days.
GPU pre-set values
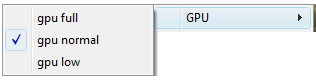
Up to three pre-set GPU temperatures can be added to the TThrottle Taskbar popup menu.
If you want to do this: copy the tthrottle.xml file from C:\Program Files\eFMer\TThrottle\examples to C:\Program Files\eFMer\TThrottle\
You can open tthrottle.xml with notepad.
The text that is displayed when you click on the TThrottle icon in the Taskbar, can be customised.
This text “Gpu Full” is placed between <Name>Gpu_Full</Name>, you can change it into any text you like.
A space between the words will be removed, use _ instead. So Gpu_Full is displayed as Gpu Full.
The temperatures 80,70,60 can be adjusted to your need. (<High> <Normal> <Low>)